I’m working with Azure for quite a while now. Almost every single one of my projects lands there eventually and even if I don’t deploy it there, I’m using one of it’s databases. Recently I’ve started using Visual Studio Team Services for storing code and managing my every pet or demo project that I want to keep private for now. But there is one service available on Azure that I’m using for a very long time with great success and I really like to have it in my project – it’s Application Insights combined with Serilog to gather, store and browse through logs and exceptions generated in my applications.
Some short explanation what is what first. Serilog is library to gather structured logs from our application. We can log both exceptions and other events that happened somewhere. I really like it because it’s simple and I can easily serialize and include some objects (ie. method arguments) into logs and easily browse and query them. I’ll show you that in a moment.
Application Insights is platform that enables monitoring our entire application. It’s like big brother. You can track single requests, exceptions, calls to remote databases and much, much more than that. It’s huge, it’s simple to learn, it’s hard to master and you can integrate almost everything that you can run on Azure with it. Let’s not go into details and just focus on logging now (still, if you’re interested in insights leave a comment, I can share some of my own insights with you).
Lets start with a simple console app. It’s just basics but if you really want you can clone it from this repo. First we need two NuGets – Serilog and Serilog.Sinks.ApplicationInsights. After that you’ll need to configure Serilog and our Application Insights sink. It’s simple snippet in our Main method.
|
1 2 3 4 5 6 7 8 9 10 11 12 13 14 15 16 17 |
class Program { private const string ApplicationInsightsInstrumentationKey = "YOU SHOULD STORE ME IN APP.CONFIG"; static void Main(string[] args) { ConfigureApplicationInsightsLogging(); } private static void ConfigureApplicationInsightsLogging() { Serilog.Log.Logger = new Serilog.LoggerConfiguration() .MinimumLevel.Verbose() // Minimum severity to log .WriteTo .ApplicationInsightsEvents(ApplicationInsightsInstrumentationKey) .CreateLogger(); } } |
Instrumentation key that I’m storing so carelessly in code should be stored elsewhere and you can get it from you Application Insights service in Azure it’s in Properties section.
Let’s skip part when we log simple stuff with that because hello world part is a bit boring. The 101 for Serilog is that you can use those five methods to log any message info our sinks, you can have more that one of them and in our case it’s just Application Insights, I’m using this with console sink and it’s enough for me.
|
1 2 3 4 5 |
Serilog.Log.Verbose("Log me"); Serilog.Log.Information("Log me"); Serilog.Log.Warning("Log me"); Serilog.Log.Error("Log me"); Serilog.Log.Fatal("Log me"); |
It’s a bit boring and it’s nothing special now. So let’s write some DTO class, pass it to some method, throw exception, catch it and log along with any arguments that are faulty. This should show us exactly what values in arguments are causing exception in our application.
So here is our simple DTO:
|
1 2 3 4 5 6 7 8 9 10 11 |
class SomeDTO { public int SomeValue1 { get; } public int SomeValue2 { get; } public SomeDTO(int someValue1, int someValue2) { SomeValue1 = someValue1; SomeValue2 = someValue2; } } |
And here is some sample method and along with place where it’s being invoked.
|
1 2 3 4 5 6 7 8 9 10 11 12 13 14 15 16 17 18 19 20 21 22 23 24 25 26 27 28 29 |
static void Main(string[] args) { ConfigureApplicationInsightsLogging(); var random = new Random(); for (int i = 0; i < 10; i++) { var dto = new SomeDTO(random.Next(0, 10), random.Next(0, 10)); DoSomething(dto); } Serilog.Log.CloseAndFlush(); // This line is important, logs are not being sent immediately, so sinks should be "flushed" safely before closing app Console.ReadKey(); } private static void DoSomething(SomeDTO dto) { try { if (dto.SomeValue1 > 5) throw new ArgumentOutOfRangeException($"Incoming dto parameter {nameof(dto.SomeValue1)} should never ever be bigger than 5!"); Serilog.Log.Information("Just received and processed dto. Incoming arguments: {@dto}", dto); } catch (Exception e) { Serilog.Log.Error(e, "Faulty args: {@dto}", dto); } } |
As you can see in highlighted lines of code (:23 and :27) I’m passing our incoming dto as parameter to Serilog methods and in message I’m referencing it by placing variable name in curly braces and prefixing it with ‘@’. That’s all you need to do to serialize anything you’ll pass there and include in message.
Take a close look at line :12, at the invocation of method Serilog.Log.CloseAndFlush() it’s really important because without it we probably won’t see anything in Application Insights. Messages are being bulked and Serilog will not send them immediately. That means we will see them with slight lag and we need to close our application safely.
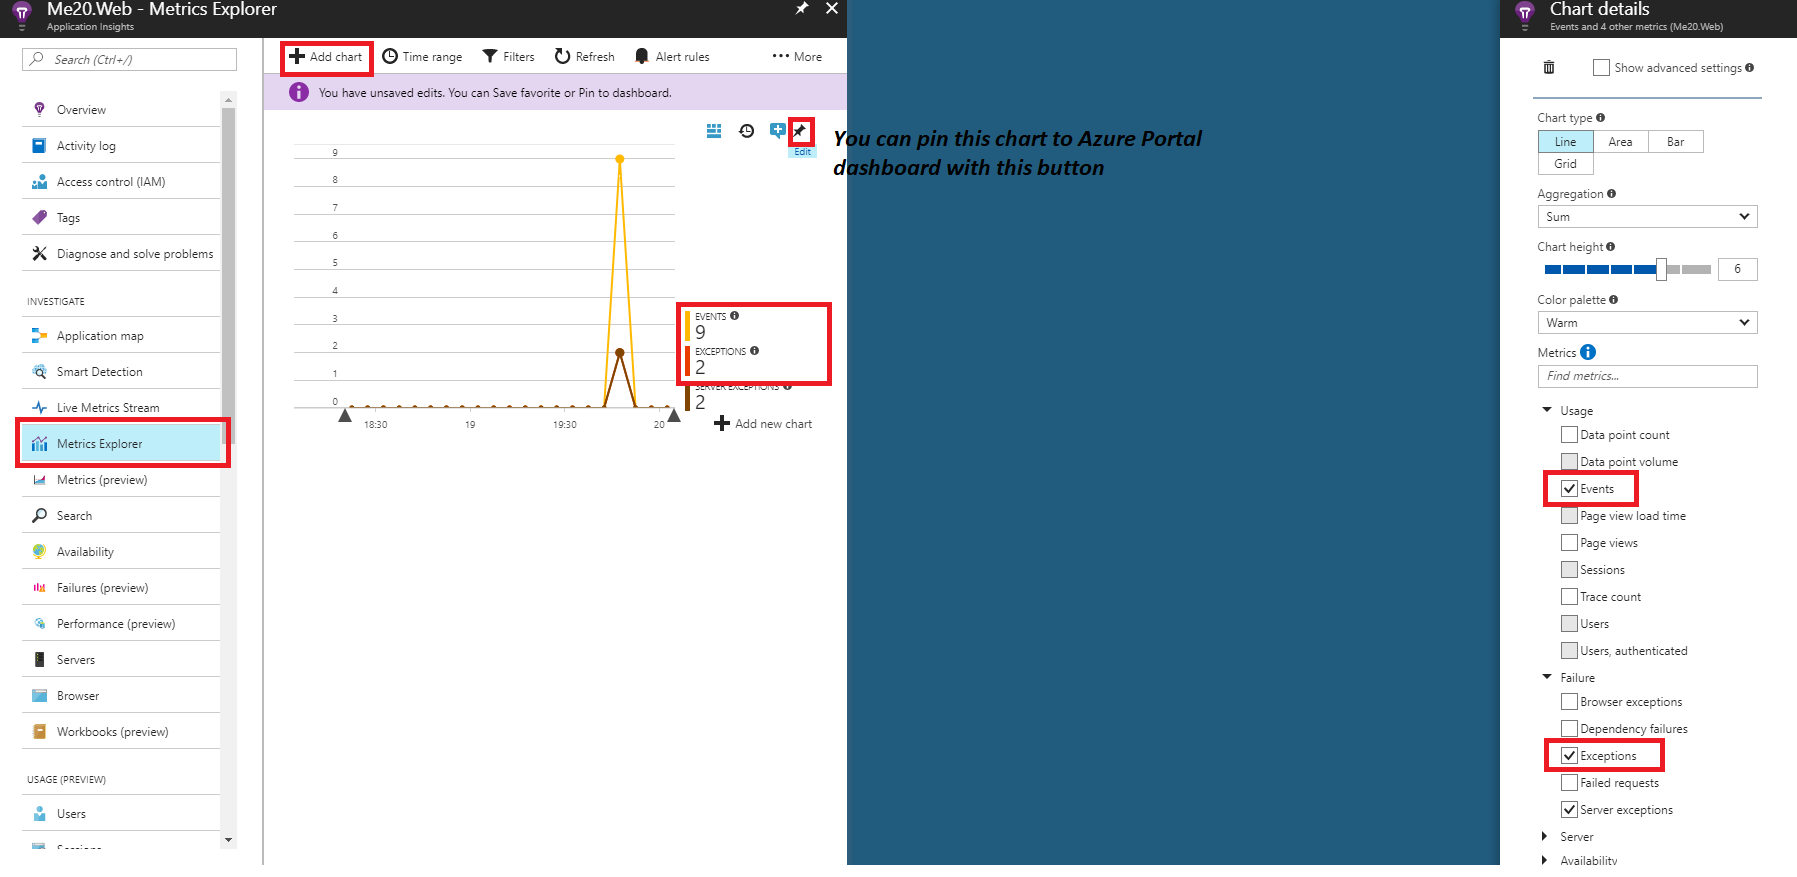
So I’ve started my application and it generated some logs. Let’s got to our azure portal, find our Application Insights service, go into Metrics Explorer and add one chart with filters like those on my screenshot.
Configuring this for exceptions is easy. Almost every single project I’m working on is configured that way and I’m having chart like that pinned to Azure Portal dashboard with time range around 4 hours so while developing it I can check for anything that happened along the way.
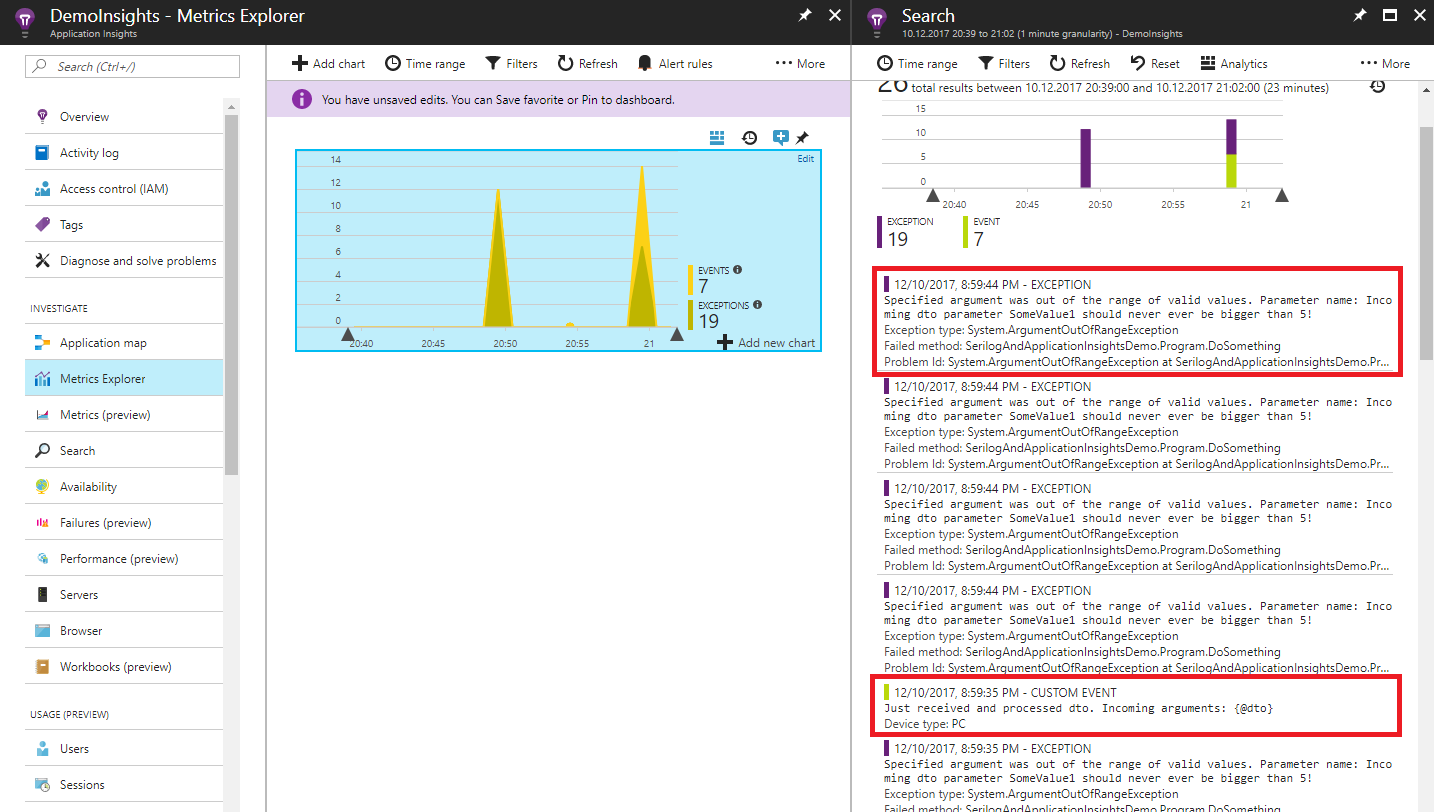
So now we have some application, some logging system and we know that sometimes things go south. We should take a look at our logs to see exact values of our faulty inputs.
We’re seeing both Information and Error logs here but still, it’s nothing special. But to see what I really like about this you need to click at any listed item to see every single property related to log item.
This is what I’m talking about. You can see every single property from our argument, and you can even navigate between previous and next exceptions that are being grouped by similarity. Imagine you have 30-40 exceptions. You can just look at them and try to figure what’s the common element for our exception or you can just take every single argument and use them in unit test case, simple as that.
And it doesn’t end at that. If you’re using VSTS for managing your project you can click “New Work Item” to create new bug report in related VSTS project along with those details and it’s really handy way of reporting bugs and assigning someone to fix in in just a few clicks. I’m still exploring VSTS but for now IMHO it’s the best environment for developing and managing projects based on Azure.
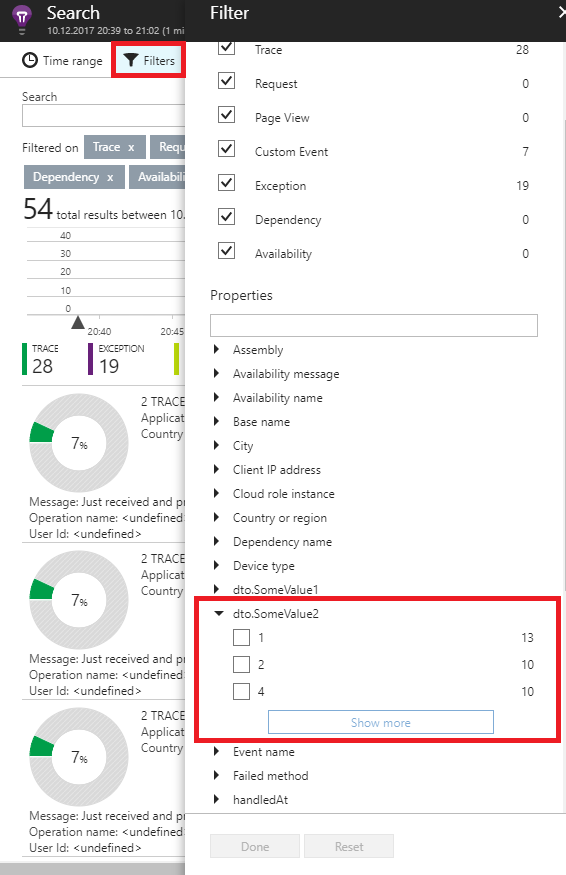
Second fun thing you can do from this window is clicking those 3 dots near our argument value and go straight to search window or even go to analytics portal, where you can write some serious, complicated queries with SQL-like syntax against everything you collected. Or you can just click through Azure portal and find some filters like that:
Lets wrap this up.
CONS:
- It requires Azure account
- It requires connection with Azure account
- It does have slight lag so data are not available immediately
- Available options in Application Insight can be overwhelming at the beggining
PROS:
- Simple to setup
- easy access to data for your unit tests cases
- Easy to query by our serialized objects properties values
- It’s free (although there are some limits)
- If you’re using Application Insights for monitoring your app you can correlate exceptions data with anything you’re collecting
- If you’re using VSTS you can create backlog items with attached exceptions details in an instant
Feel free to clone app from this repo, link it to your Azure Application Insights, generate some entries and click through some of those options. Maybe you’ll hate it but maybe it’s what you’re looking for.


